1. Page 1: intended for anyone. This page includes:
2. Page 2: intended for school admin & education policy makers. This page includes:
3. Page 3: intended for researchers and analysts. This page includes:
The Progression-of-EDLD-652-Final Repo contains all of the past iterations of these figures, as required by the final project. Note that past iterations used “harsh” punishments, which is a broader category than exclusionary. This was changed for consistency with the majority of the literature; of note, the findings did not change appreciably.
Background
As a former teacher and a prevention scientist, I can say disciplinary actions are given to students inequitably; sometimes this can be chalked up to circumstantial differences, but often it’s due to biases carried by the administration.
Such inequities manifest as Black students recieving a disproportionate number of “exclusionary” disciplinary actions, compared to their other racial-ethnic counterparts—particularly White students.
“Exclusionary disciplinary action” is any action which removes a student from the school (e.g., suspension, expulsion, etc.). Such exclusionary punishments are shown to contribute directly to the school-to-prison pipeline. This is not meant to be a deep-dive into the literature, but this Google Scholar link can get you started if you’re interested.
Current Project
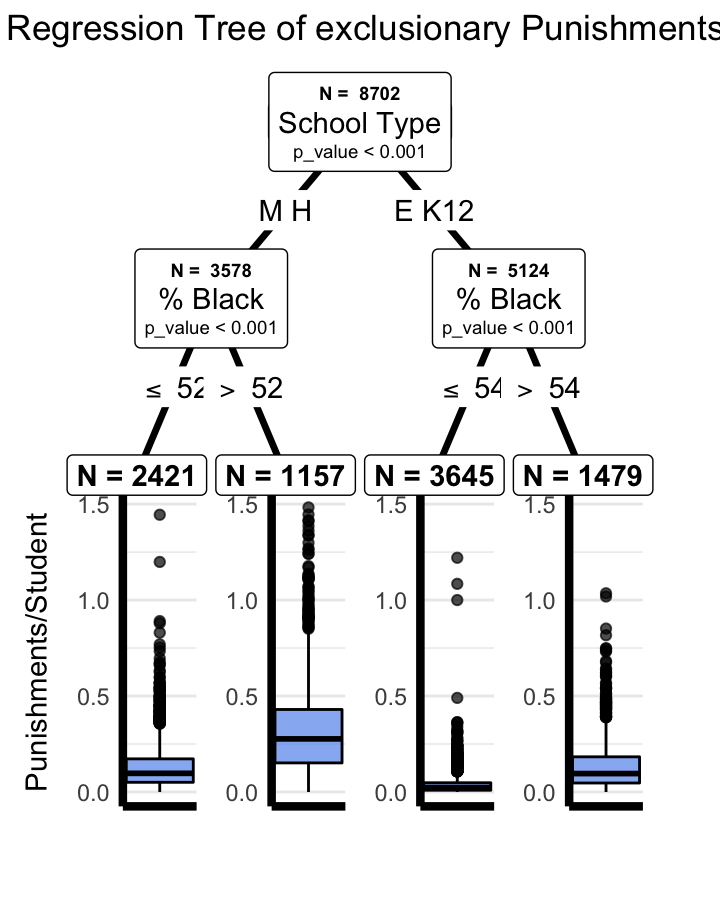
This dashboard is an exploratory analysis of inequity in exclusionary punishments among demographic characteristics in Georgia schools, defined as:
Data
The data set represents over 2,000 schools in nearly 200 districts across the state of Georgia, and merges data from the Governer’s Office of Student Achievement and the Georgia Department of Education over 4 academic years, beginning in 2015.
Single imputation was used for all models, as pooling multiple imputed data sets is not interpretable to the target audience (and is not integrated into mixed effects regression trees). Imputation was done with the {mice} package with all variables included in the data set. Missingness in state-reported data stems from districts which had numbers too small to report. As previously stated, the data can be seen on Page 2
I trained a neural network with 3 years of data to predict the number of exclusionary punishments at a school. The model allows you to input your own values for all parameters with sliders and drop down menus (except year which is fixed to 2015).
By changing only a few variables at a time, you can see the relative impact of a given variable or the interactive effect of a few
The model was tuned with k-fold cross validation where k = 4, and final evaluation was done with the next year’s data. The model defaults to the average of each value for each parameter, and chooses the first school on the list.
Note that this allows you to make some impossible projections (e.g., 100% Black students & 100% White students & 100% Hispanic students; selecting a school and a different district which doesn’t house that school; selecting high school by name and seeing what would happen if it were an elementary school, etc.). For that reason, good logic should be used in its interpretation. Eventually, I’ll improve the user interface and allow the year to be changed. I might even prevent impossible combinations, but not yet. Code for the final neural net was:
model <- keras_model_sequential() %>%
layer_dense(units = 64, activation = "relu",
input_shape = 18,
kernel_regularizer = regularizer_l1_l2(l1 = 0.001, l2 = 0.001)) %>%
layer_dropout(rate = 0.25) %>%
layer_dense(units = 64, activation = "relu",
kernel_regularizer = regularizer_l1_l2(l1 = 0.001, l2 = 0.001)) %>%
layer_dropout(rate = 0.25) %>%
layer_dense(units = 64, activation = "relu",
kernel_regularizer = regularizer_l1_l2(l1 = 0.001, l2 = 0.001)) %>%
layer_dropout(rate = 0.25) %>%
layer_dense(units = 1)
model %>% compile(
optimizer = "rmsprop",
loss = "mse",
metrics = c("mae")
)
history <- model %>%
fit(train_scale,
train_targets,
epochs = 25,
batch_size = 1,
verbose = 1)